
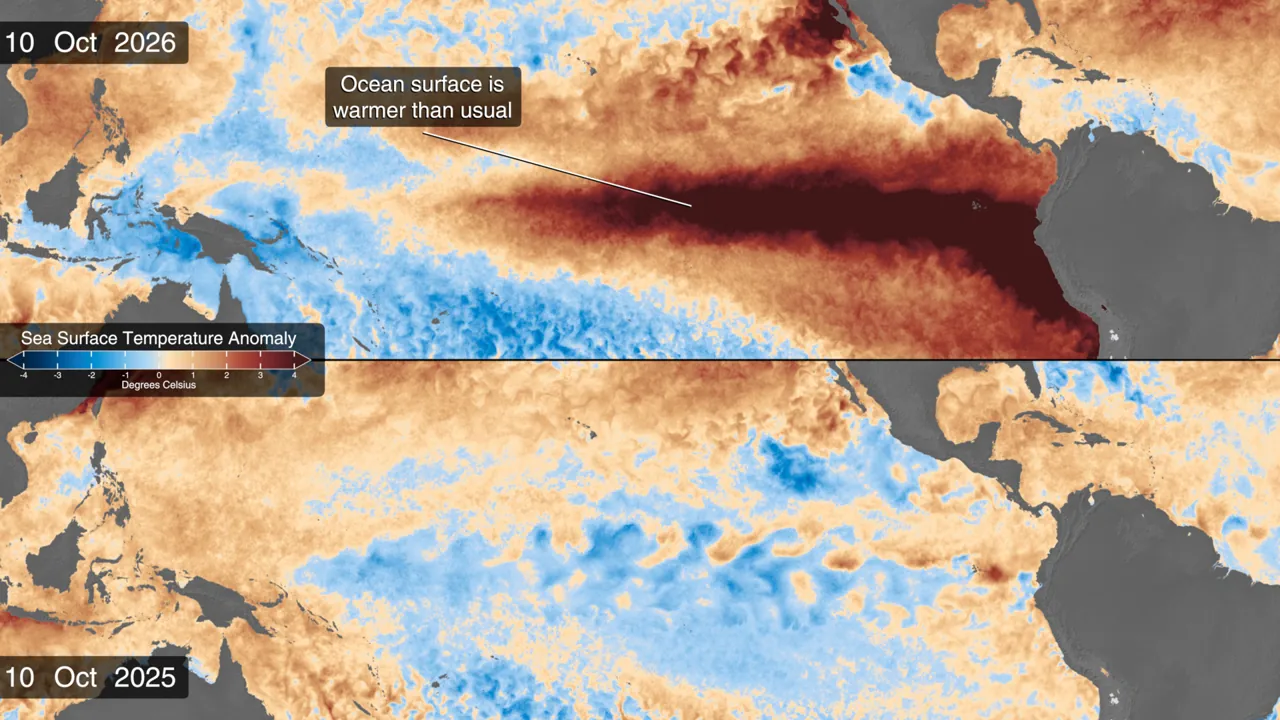
El Niño is reshaping the Pacific, and NASA’s new maps reveal connections that an isolated forecast cannot: ocean heat, sea-surface height and microscopic life at the base of part of the marine food chain. An explanation published on October 15 compares conditions in 2026 with the weak La Niña episode observed a year earlier.
The interest goes beyond striking colors. NOAA’s October assessment assigns a high probability to an event of historic intensity. That is a scenario calculated from observations and models, not confirmation that every potential consequence has already happened.
What the 83% probability means
The October 8 outlook gives an 83% probability of historic intensity during October–December, using a threshold of at least +2.5°C in the three-month relative oceanic index. That number refers to a particular indicator and period. It does not mean temperatures in every city will increase by 2.5 degrees.
The assessment also expects strong or very strong conditions to persist through the Northern Hemisphere winter. An event of this scale can shift rainfall and temperature patterns, but its effects are not identical in every country or season.
More than surface warming
Sentinel-6 satellites observe sea-surface height. Warmer water expands, while waves moving heat eastward help reshape conditions across the equatorial Pacific. Weaker trade winds also reduce the upward movement of deep, nutrient-rich water.
PACE adds another perspective: ocean color can reveal changes in phytoplankton. A reduced supply of nutrients can diminish these microscopic populations. This is more than the water simply looking bluer, and the image alone is not evidence of pollution.
Together, the observations help scientists connect the physical behavior of the ocean with changes in its biological activity. Temperature, height and color are complementary measurements, rather than interchangeable ways of displaying the same quantity.
What it can tell us about Mexico
El Niño provides context for Mexican seasonal forecasts, but it does not replace a local warning about rain, drought or a tropical cyclone. Predicting tomorrow’s conditions in one city requires a specific weather forecast. A global map cannot supply that precision.
The published comparison shows sea-surface temperature anomalies: differences from a reference value. Red does not mean boiling water, and blue does not establish that a location is free of risk. The useful information is how the system develops and changes the likelihood of different conditions over the months ahead.