
Anthropic introduced Claude Dashboards and Claude Motion to turn data into dashboards and explanations into animations. Both features are arriving in beta, but access differs: Dashboards is available on paid plans, while Motion is available on Team and Enterprise. Docs, Slides, and Design are leaving beta and will also be available on the free plan, according to the official announcement.
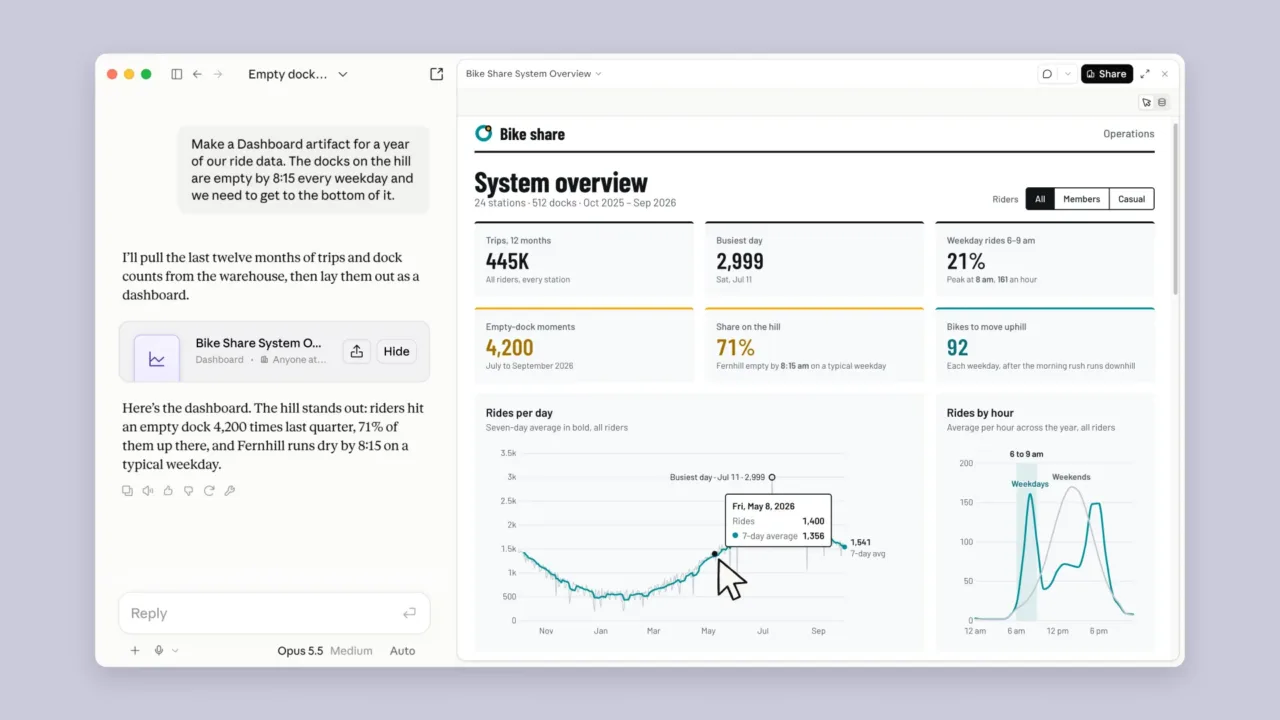
Dashboards lets you connect data platforms and request a visualization in natural language. The integrations the company mentions include BigQuery, Databricks, Snowflake, Amazon Redshift, and ClickHouse, as well as connectors such as Salesforce. The information comes from connected systems and their permissions; it does not appear just because you type a company’s name.
The useful thing is being able to check where each number comes from
Each chart shows the query that produces it and when its data was updated. That traceability helps catch errors that an attractive chart can hide: different time periods, forgotten filters, duplicate records, or an incorrect definition of the metric.
For example, a dashboard about weekly sign-ups can look right even if it counts the same person multiple times. Reviewing the query and the data definition is still part of the work. The tool speeds up an initial exploration; it does not turn every answer into a financial report or a measurement ready for approval without review.
Motion looks like a video, but it’s built differently
Claude Motion generates code that animates text, charts, shapes, and images. The result can be adjusted in the editor, modified with prompts, and downloaded as an MP4. It is designed for explanations, product walkthroughs, and presentations with motion.
The distinction matters: it does not use a video-generation model to invent scenes or people. You can change a word, a figure, or the timing of a transition because those elements are part of an editable composition. This is a different approach from requesting a cinematic scene and receiving a few seconds of generated footage.
Permissions and plans before sharing
In Enterprise, Dashboards and Motion are disabled by default, and an administrator can enable them in the Artifacts settings. Options for sharing with other people also depend on the organization’s rules. Connecting a database and making a link public are decisions with different effects.
For a small team in Mexico, the useful question is what repetitive task could be simplified: checking sales, explaining a process, or preparing a report. Before opening a dashboard to others, make sure it does not expose customer information or internal data that should not be shared.
The announcement presents tools that fit into work with documents and data. Their value can be verified when the query is correct, the information is up to date, and the result is understandable; a flashy animation alone does not solve those three conditions.